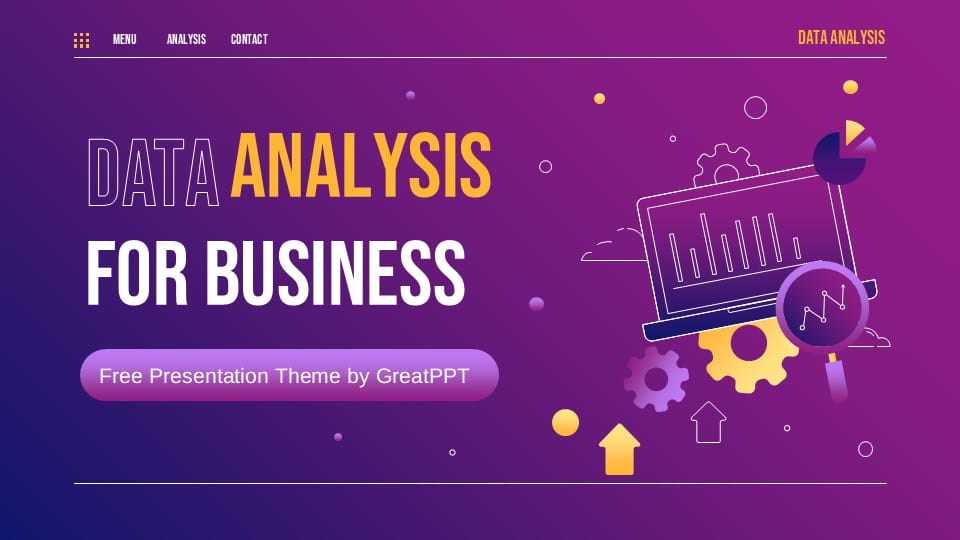
Data Analysis for Business Presentation
Data Analysis for Business Presentation
Free PowerPoint template and Google Slides theme
Data is just noise until you give it a narrative. In today’s market, being “data-driven” isn’t enough; you have to be “data-articulate.” Whether you’re a business analyst presenting Q3 growth metrics to the board, a marketing strategist justifying a pivot in ad spend, or a consultant breaking down supply chain efficiencies, you need a deck that makes the complex feel intuitive.
The Data Analysis for Business template for Google Slides and PowerPoint is a high-precision toolkit designed for the modern professional. It moves away from cluttered, “math-heavy” slides and settles into a sleek, high-authority aesthetic that turns spreadsheets into actionable stories.
The Aesthetic: Clean Connectivity & Professional Depth
This isn’t just a collection of charts; it’s a Visual Dashboard. The design language is built on the philosophy of “Informed Clarity”:
-
The “Insight” Palette: Utilizing a sophisticated blend of business blues, slate teals, and light grays. This palette is psychologically designed to convey stability and intelligence, ensuring your audience feels confident in the numbers you’re presenting.
-
Minimalist UI/UX Influence: The template features thin lines, generous white space, and subtle card-based layouts that mirror modern data software interfaces. It feels “live” and up-to-the-minute, not like a static relic of the past.
-
Balanced Typography: By pairing bold sans-serif headers with a clean, high-legibility font for data labels, the template ensures that your “Key Performance Indicators” (KPIs) remain the undisputed stars of the show.
Design Logic: Built for the “So What?” Factor
The structural logic behind this template focuses on Analytical Hierarchy and Result-Oriented Pacing:
-
The “Funnel-to-Fact” Framework: Specialized layouts are designed to guide the audience from broad market trends down to specific, granular insights. It’s perfect for explaining the why behind the what.
-
Advanced Visualization Tools: We’ve replaced basic bar charts with integrated dashboards, comparative tables, and heat-map placeholders. This allows you to show correlations—like the relationship between customer churn and seasonal pricing—with surgical precision.
-
Action-Oriented Closures: The deck includes specific layouts for “Recommendations” and “Next Steps,” ensuring your presentation ends with a clear call to action rather than a confusing data dump.
Strategic Use Cases: Mastering the Boardroom
This is a High-Performance Communication Toolkit built for the architects of business growth:
-
Quarterly Business Reviews (QBRs): Perfect for department heads who need to showcase achievements and address bottlenecks with objective clarity.
-
Market Research & Competitive Analysis: Ideal for analysts presenting consumer behavior trends or identifying “blue ocean” opportunities in crowded sectors.
-
Investment & Financial Briefings: A go-to resource for CFOs and founders who need to demonstrate fiscal health and ROI projections to skeptical stakeholders.
Features of this template
- 100% editable and easy to modify
- 34 Different slides to impress your audience
- Contains easy-to-edit graphics such as graphs, maps, tables, timelines and mockups
- Includes 500+ icons for customizing your slides
- Designed to be used in Google Slides, Microsoft PowerPoint & Canva
- Includes information about fonts, colors, and credits of the resources used
Video Preview of Data Analysis for Business Presentation
Share Now!
Recent Templates





Related Products

Same Contributor



Featured Products