Forecasting Management Presentation
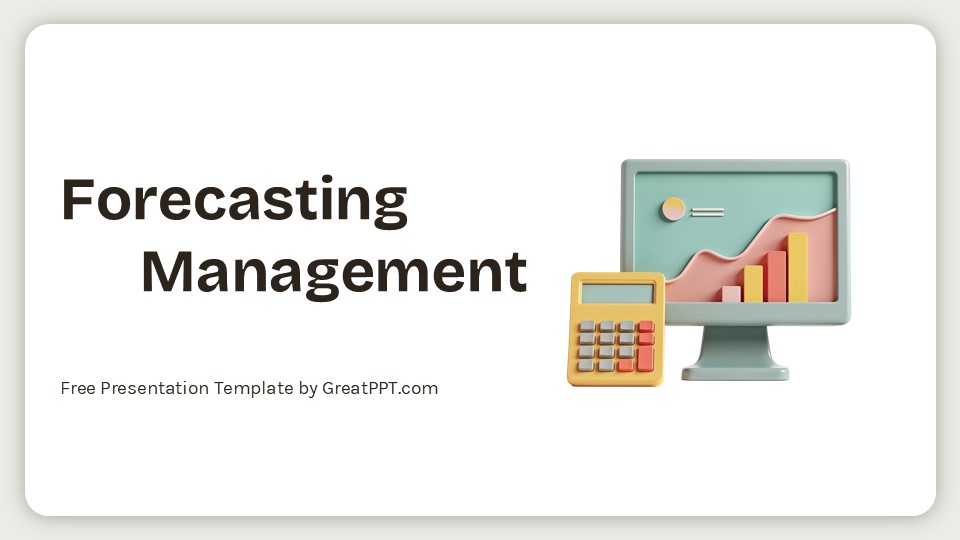
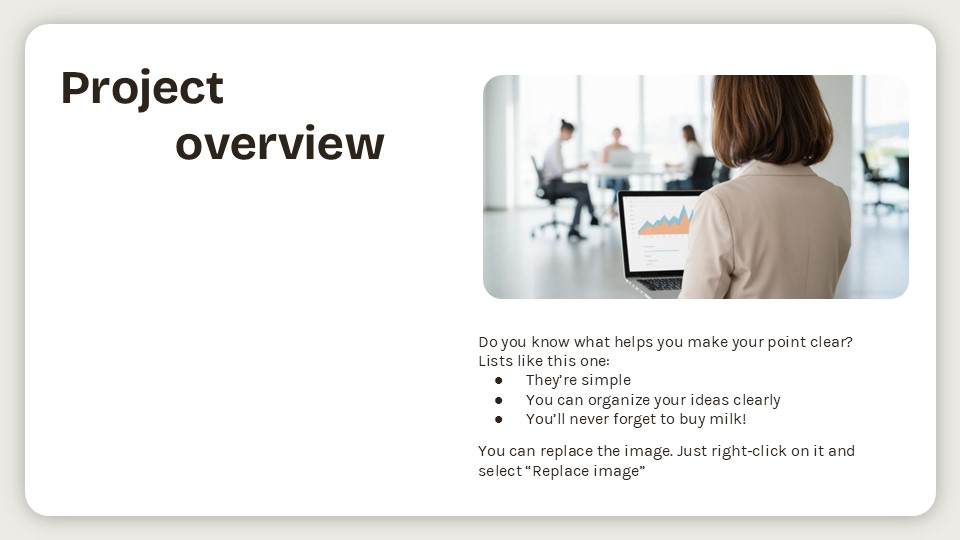
Forecasting Management Presentation
Free PowerPoint template and Google Slides theme
In the business world, a “guess” is just a liability. Whether you are a supply chain director predicting inventory needs, a CFO projecting year-end revenue, or a marketing lead estimating seasonal demand, your stakeholders aren’t looking for a crystal ball—they’re looking for a calculated strategy. If your data looks disorganized, your projections won’t just be questioned, they’ll be ignored.
The Forecasting Management template for Google Slides and PowerPoint is a high-precision asset designed for the analytical professional. It moves away from the cluttered “spreadsheet-dump” style and settles into a clean, structured, and logic-driven aesthetic that transforms raw historical data into a credible vision of what’s coming next.
The Aesthetic: Mathematical Precision & Corporate Clarity
This isn’t just a slide deck; it’s a Predictive Dashboard. The design language is built on the philosophy of “Informed Certainty”:
-
The “Stability” Palette: Utilizing a professional foundation of deep navy, teal accents, and crisp grays. This color story is psychologically engineered to project reliability and calm, essential when presenting future risks or aggressive growth targets.
-
Structured Geometric Layouts: The template features clean borders, distinct content blocks, and a clear linear flow. This “orderly” design ensures that even the most complex statistical correlations feel organized and digestible.
-
High-Contrast Typography: By pairing bold, authoritative headers with a clean sans-serif typeface, the template ensures that your “Confidence Intervals” and “Projected Totals” are the clear focal points of every slide.
Design Logic: Built for the “Predictive Narrative”
The structural logic behind this toolkit focuses on Trend Analysis and Strategic Pacing:
-
The “Past-to-Future” Framework: Specialized layouts are designed to guide your audience from “Historical Benchmarks” to “Current Variance” and finally into “Future Projections.” It tells the story of how you reached your conclusions.
-
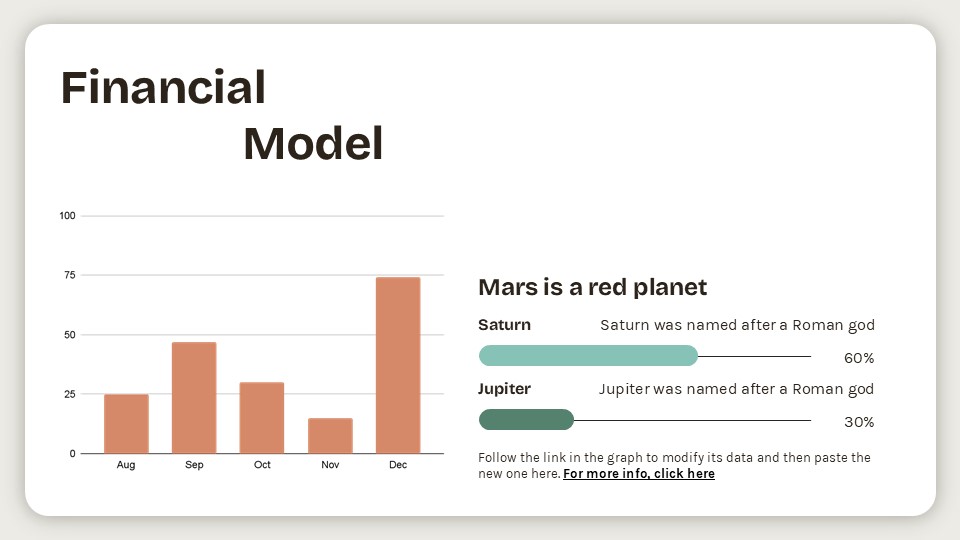
Advanced Statistical Visualization: We’ve replaced basic charts with integrated trendlines, comparative bar graphs, and probability distributions. This allows you to visualize “Best-Case” and “Worst-Case” scenarios with surgical precision.
-
Risk & Opportunity Assessment: The deck includes dedicated sections for “Sensitivity Analysis” and “Assumptions,” ensuring your forecast is seen as a robust, vetted plan rather than just a hopeful estimate.
Strategic Use Cases: For the Architects of Growth
This is a High-Performance Decision Toolkit built for those who manage by the numbers:
-
Financial & Budgetary Planning: Perfect for analysts and managers who need to present Q4 projections or multi-year fiscal roadmaps to executive boards.
-
Supply Chain & Demand Forecasting: Ideal for logistics professionals identifying seasonal trends, lead-time variances, and inventory optimization strategies.
-
Sales & Market Expansion: A go-to resource for sales directors presenting pipeline velocity and projected market share growth to potential investors or internal partners.
Features of this template
- 100% editable and easy to modify
- 13 Different slides to impress your audience
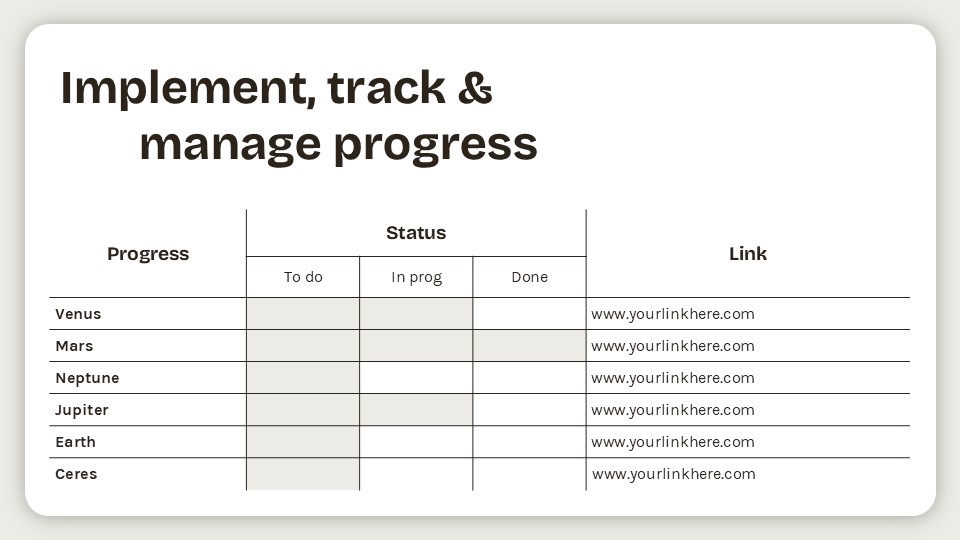
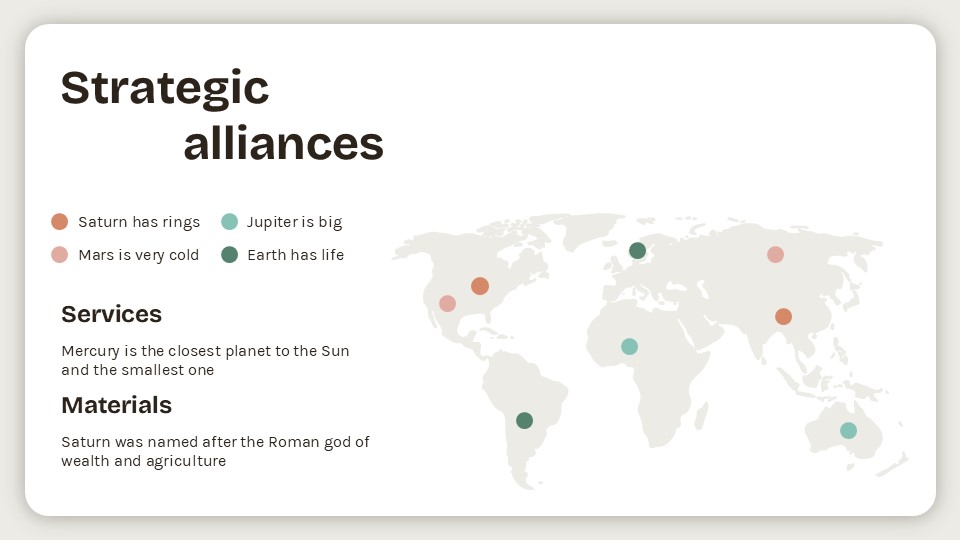
- Contains easy-to-edit graphics such as graphs, maps, tables, timelines and mockups
- Includes 500+ icons for customizing your slides
- Designed to be used in Google Slides, Microsoft PowerPoint & Canva
- Includes information about fonts, colors, and credits of the resources used
Video Preview of Forecasting Management Presentation
Share Now!
Recent Templates



Related Products
Same Contributor


Featured Products